As Mega Millions Grows, Here Are the Most Commonly Drawn Numbers
Posted on: September 5, 2024, 02:27h.
Last updated on: September 5, 2024, 02:27h.
The Mega Millions jackpot for Friday night’s drawing has ballooned to an estimated $740 million, the interstate lottery game’s seventh-richest prize ever offered.

No Mega Millions ticket has matched the five white balls and gold Mega Ball since June 4 when a ticket sold in Illinois claimed a $552 million jackpot. There have been 26 drawings since, with tens of millions of tickets sold, without a single one matching the night’s six winning numbers.
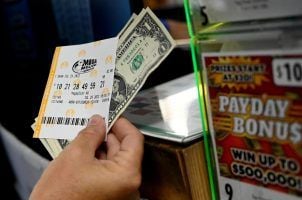
Tomorrow at 11 pm EST from the Mega Millions draw studio in Atlanta, five white numbers from a pool of 90 balls and a gold Mega Ball from a pool of 25 will be drawn. The odds of a ticket winning the top prize remain constant at a dismal one in 302,575,350, but as more people participate as the headline-making jackpots garner media coverage, it’s more likely that the jackpot will be hit because more possible number combinations are covered.
The one-time cash option is an estimated $366.3 million. Both amounts are before a federal tax of 37%, the top tax bracket, and possibly state income taxes.
The lump sum if chosen would immediately be reduced by $135.5 million to approximately $230.8 million.
Number Frequency
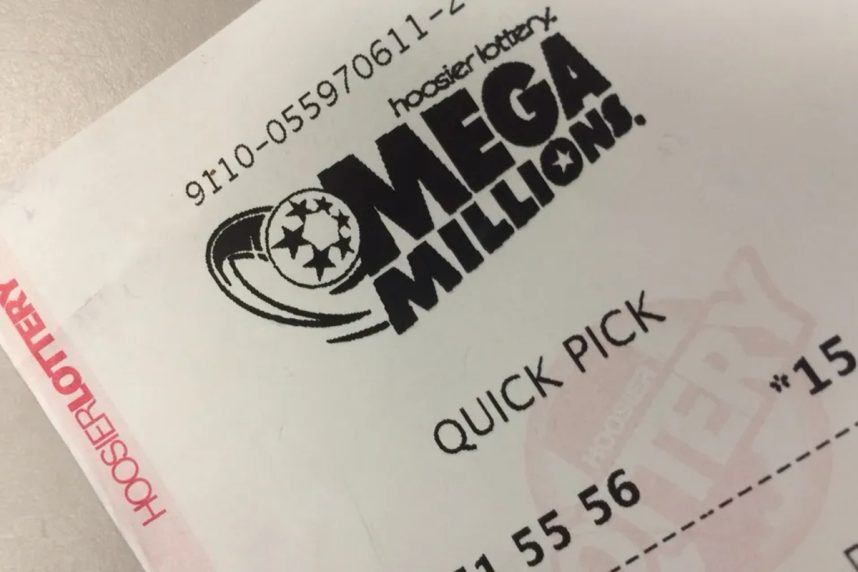
Most Mega Millions and Powerball players use the quick pick function to select their ticket numbers. But data suggests you might improve your odds ever so slightly by taking the time to carefully pick your six numbers.
According to USA Mega, an online database that tracks Powerball and Mega Millions draws, wins, and lottery news, the white Mega Millions Nos. 3 and 10 are drawn more often than any other number in the 90-ball pool.
Based on 715 Mega Millions drawings dating back to Tuesday, Oct. 31, 2017, the Nos. 3 and 10 were each drawn 67 times, or 9.37% of the total draws. No. 10 was most recently drawn on Aug. 30. No. 3 was last drawn on July 23.
The No. 17 has been drawn the next most at 64, or 8.95% of the time. Nos. 14 and 31 were drawn 62 times, or 8.67%, to rank tied for fourth.
As for the Mega Ball, the easiest way to win back your $2 per play wager, the gold Nos. 11 and 22 have delivered more wins than any other number in the 25-ball pool. The 11 and 22 gold Mega Balls have each been drawn 39 times, or 5.45% of the 715 drawings.
The No. 24 Mega Ball has come up 36 times, or 5.03%, and the No. 18 Mega Ball was drawn 35 times, or 4.9%.
On the other end, the white No. 49 ball has been the unluckiest Mega Millions ball. The 49 has been pulled just 36 times, or 1.01%. Other unlucky white balls include Nos. 50, 35, 65, and 51. As for Mega Balls, No. 23 has been drawn the least at just 20 times or 2.8%.
For a full breakdown of the Mega Millions statistics, click here.
Lottery Probability
Some lottery players after examining the Mega Millions statistics might be inclined to pick the numbers that have been drawn the least in the thinking that those numbers are due. But mathematicians say there’s no science or strategy in picking lottery numbers.
Nick Kapoor, a mathematics professor at Connecticut’s Fairfield University, explains that nothing in the past or future affects an individual lottery drawing event. He says even utilizing the aforementioned Mega Millions chart showing which numbers are drawn more often improves one’s odds of winning the jackpot by 0.0001 to 0.00002%.
It’s still very, very improbable,” Kapoor said.
Related News Articles
Powerball Dodges Players Again, Jackpot Swells to $835M
Mega Millions Jackpot Enters Record Territory, Next Drawing Tonight
Most Popular
FTC: Casino Resort Fees Must Be Included in Upfront Hotel Rates
Genovese Capo Sentenced for Illegal Gambling on Long Island
NBA Referees Expose Sports Betting Abuse Following Steve Kerr Meltdown
UPDATE: Former Resorts World & MGM Grand Prez Loses Gaming License
Most Commented
-
UPDATE: Whiskey Pete’s Casino Near Las Vegas Closes
— December 20, 2024 — 30 Comments -
Caesars Virginia in Danville Now Accepting Hotel Room Reservations
— November 27, 2024 — 9 Comments -
UPDATE: Former Resorts World & MGM Grand Prez Loses Gaming License
— December 19, 2024 — 8 Comments -
FTC: Casino Resort Fees Must Be Included in Upfront Hotel Rates
— December 17, 2024 — 7 Comments


Last Comment ( 1 )
Yeah, yeah. I’ve used the hot, cold and overdue system for years. Somebody from CA or NJ will win. I wish I could bet on that.